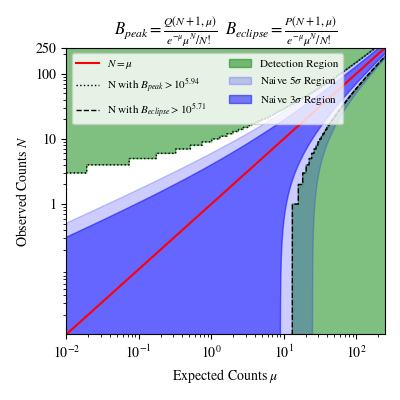
Plots
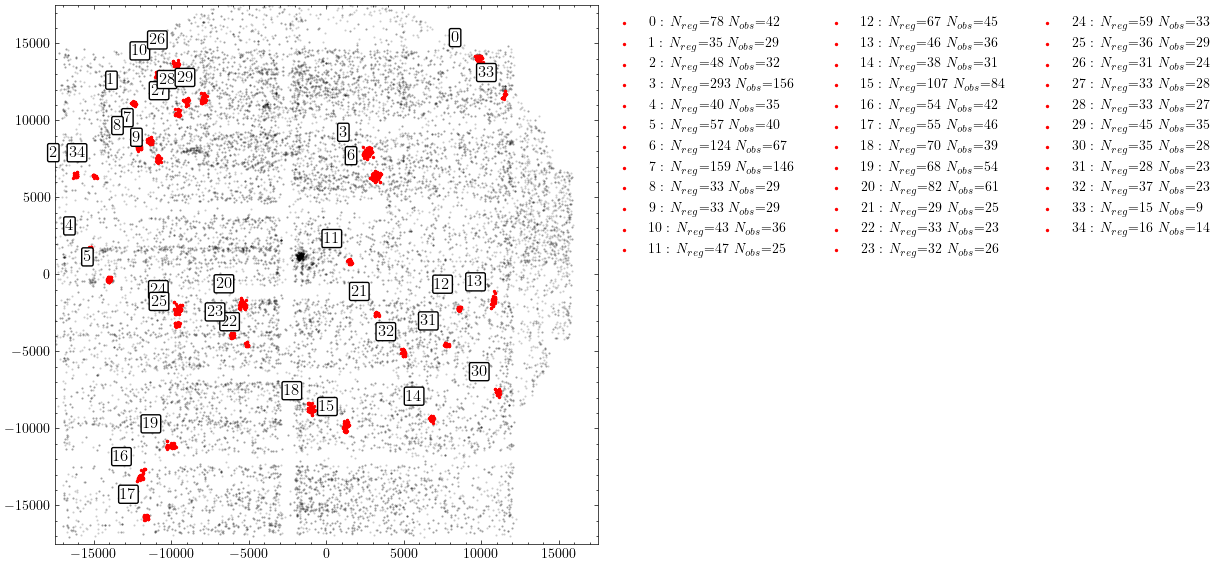
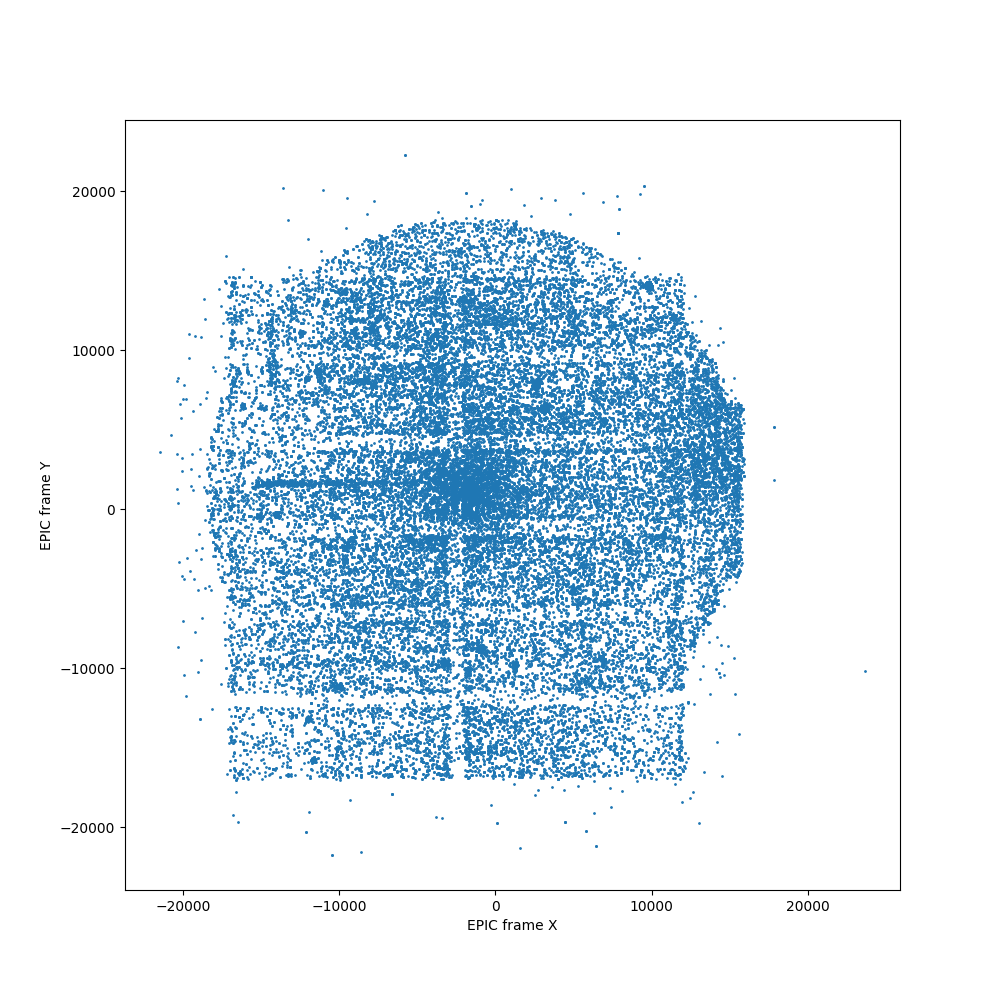
02_12_spatial_dist.png
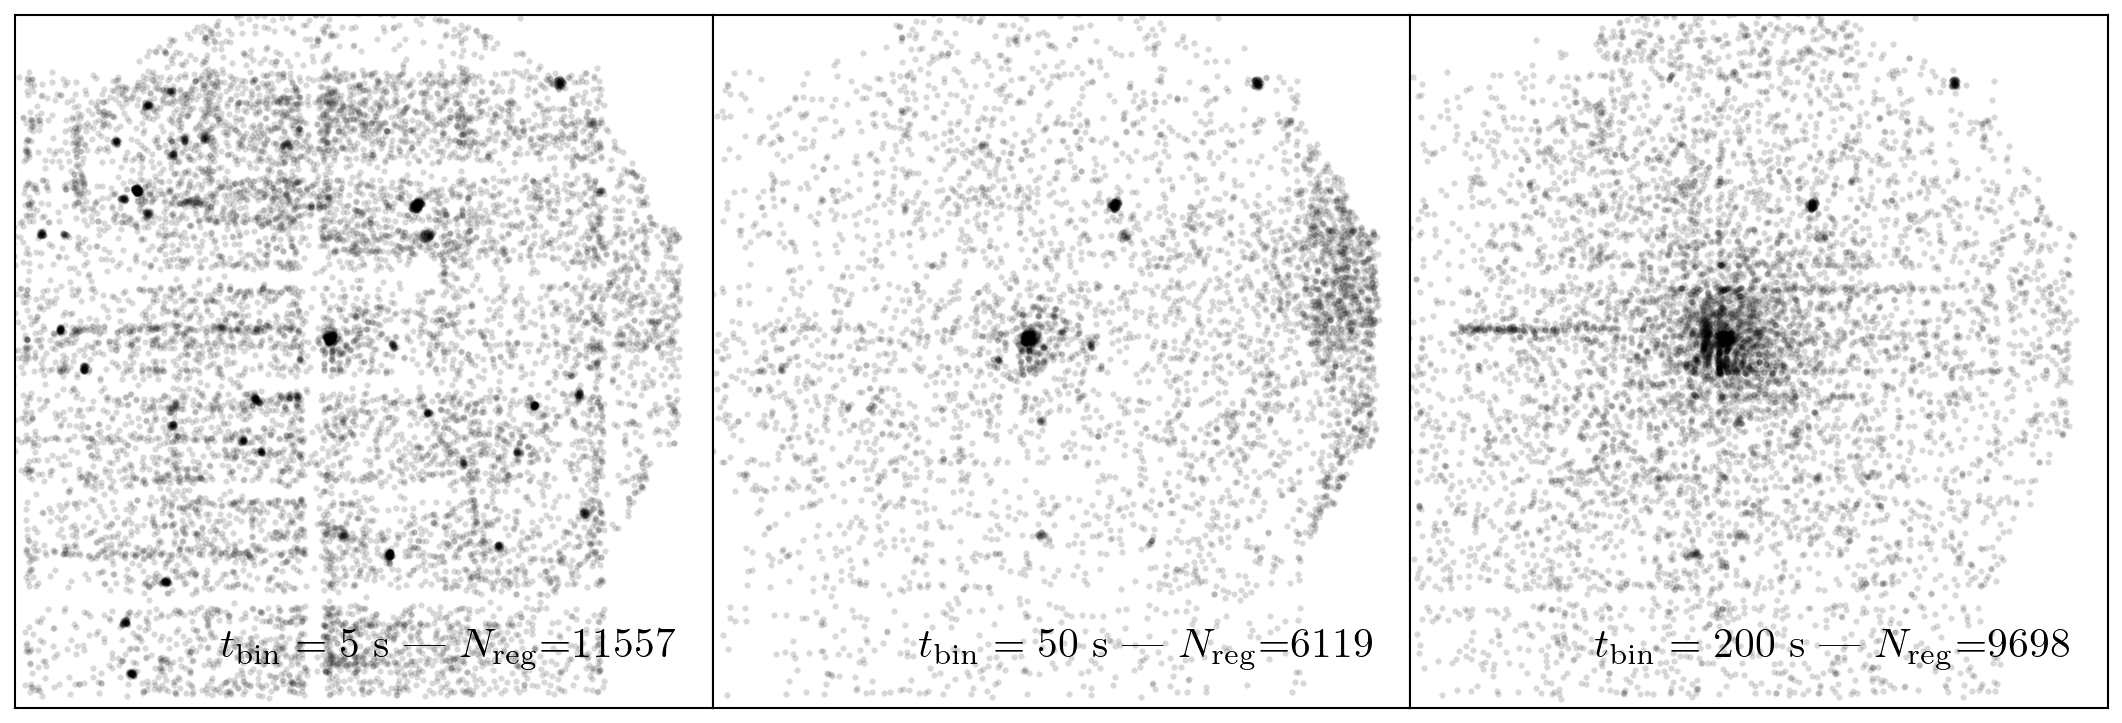
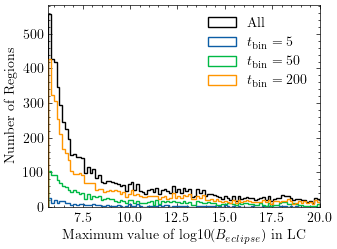
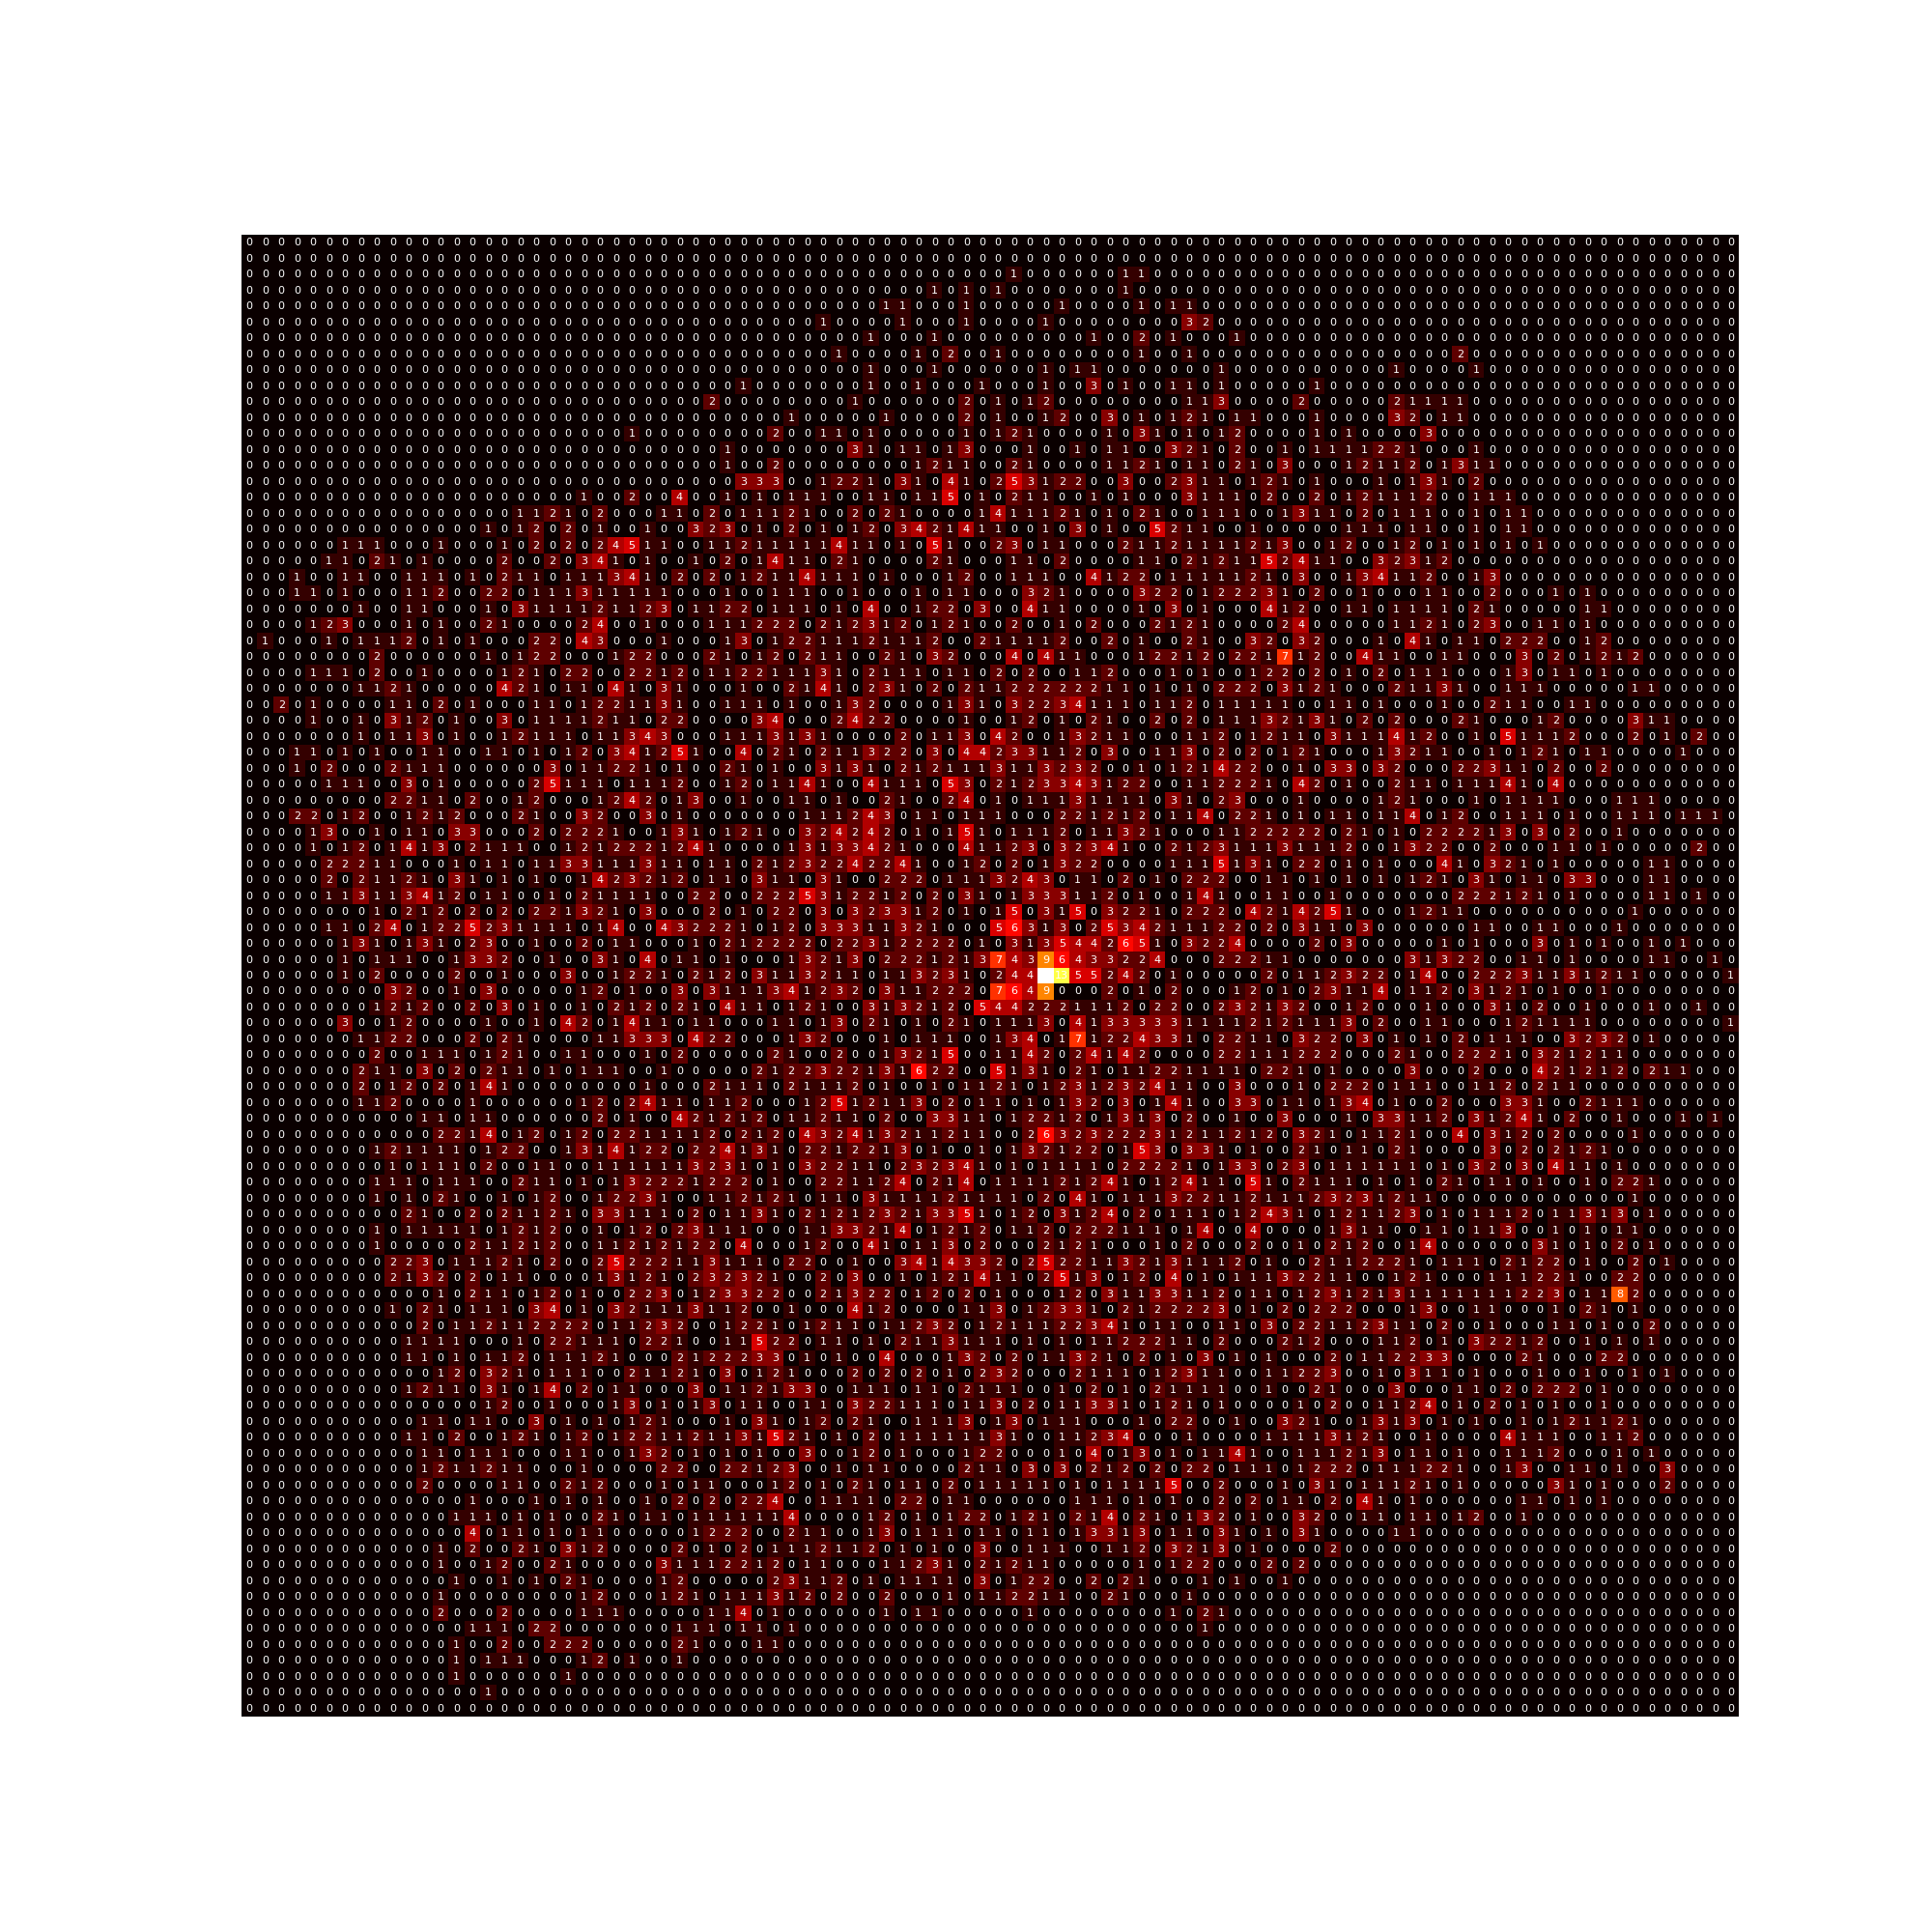
hot_regions_200_s.png
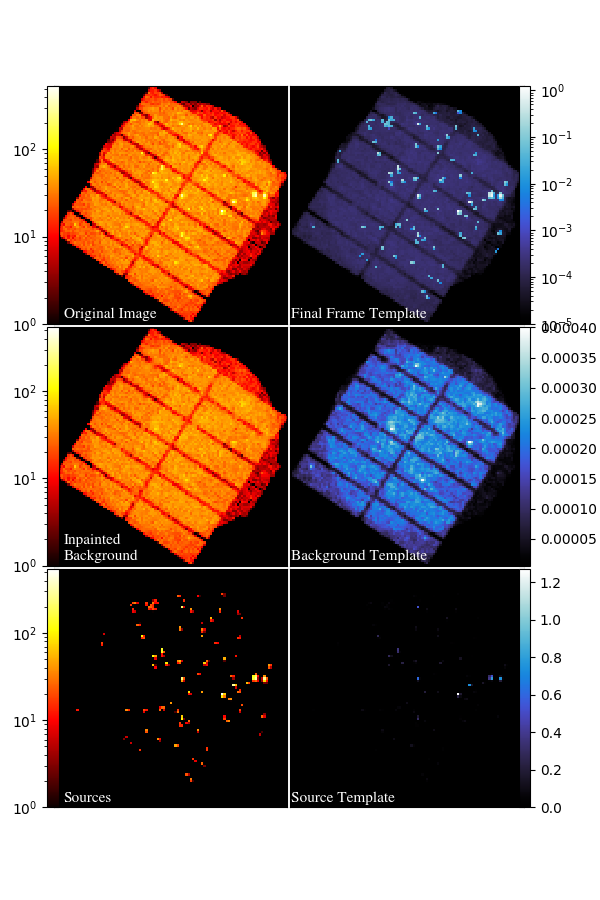
template_creation.png
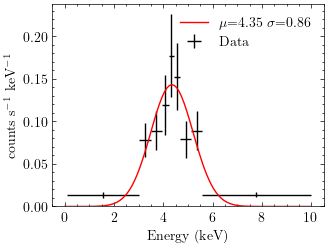
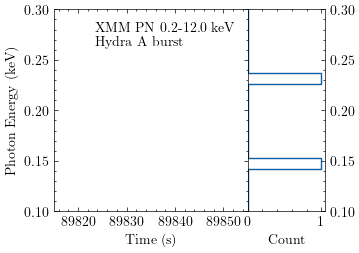
Tornado_burst_spec.png
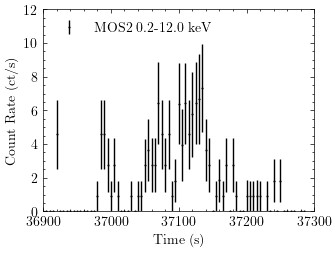
tornado_burst_lc_lccorr.png
hot_regions_5s.png

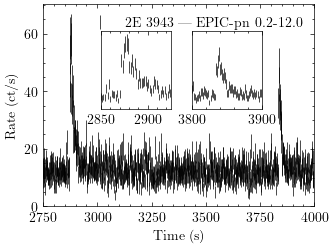
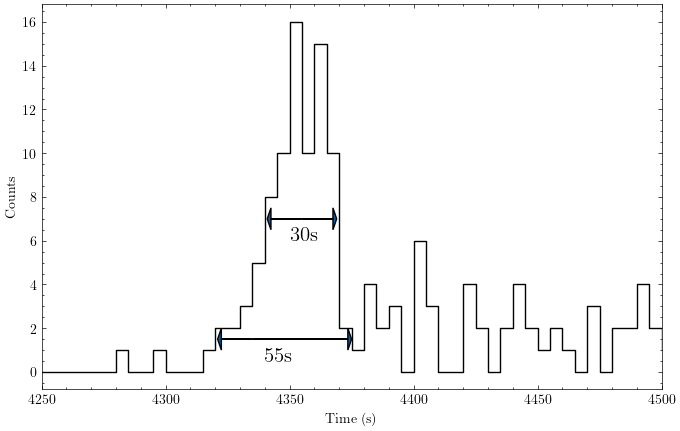
double_burst_e2_3943.png
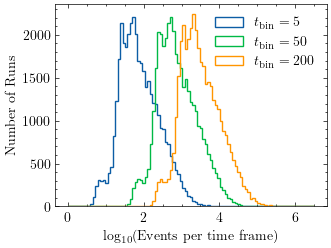
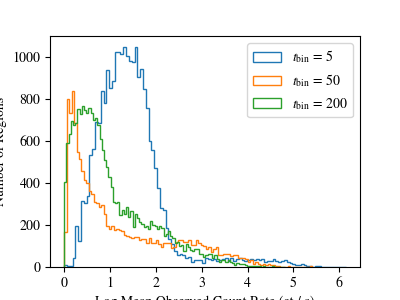
events_per_time_frame_hist.png
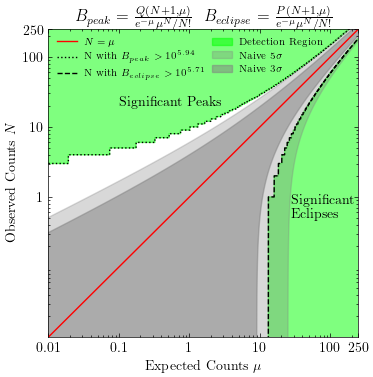
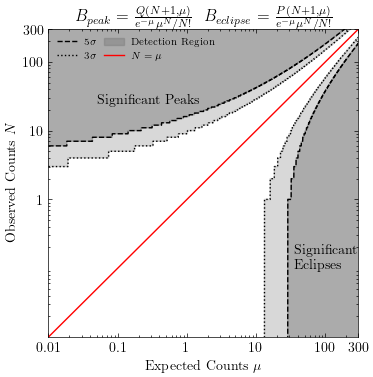
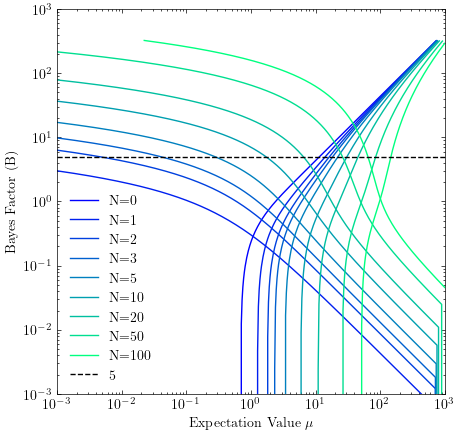
bayesfactorlimits_3_zoomed.png
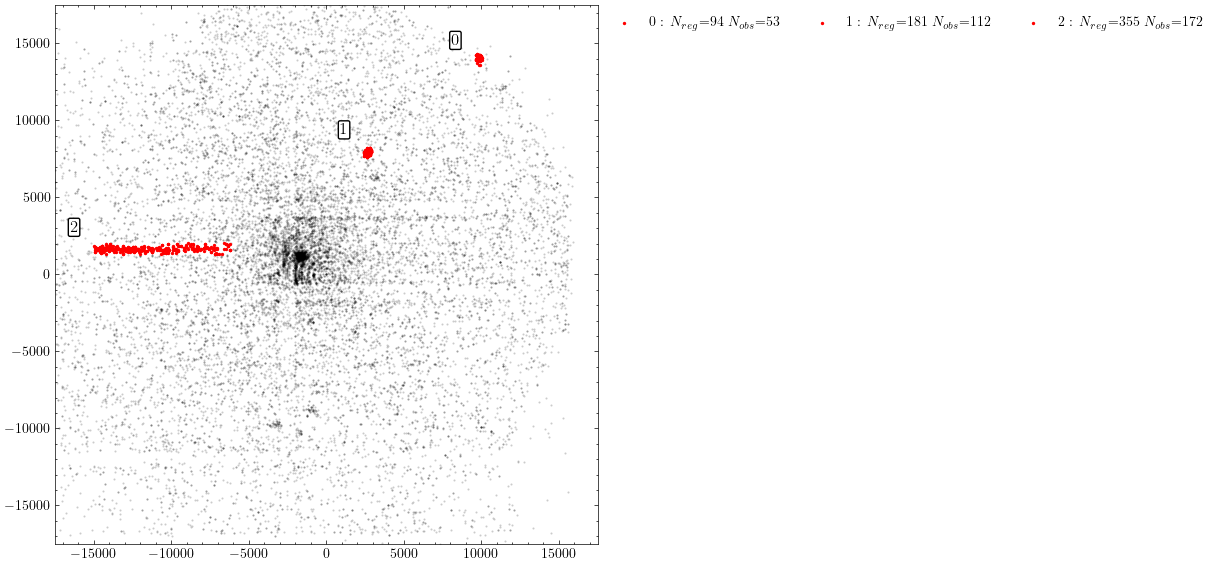
transients_scatter_rotated.png
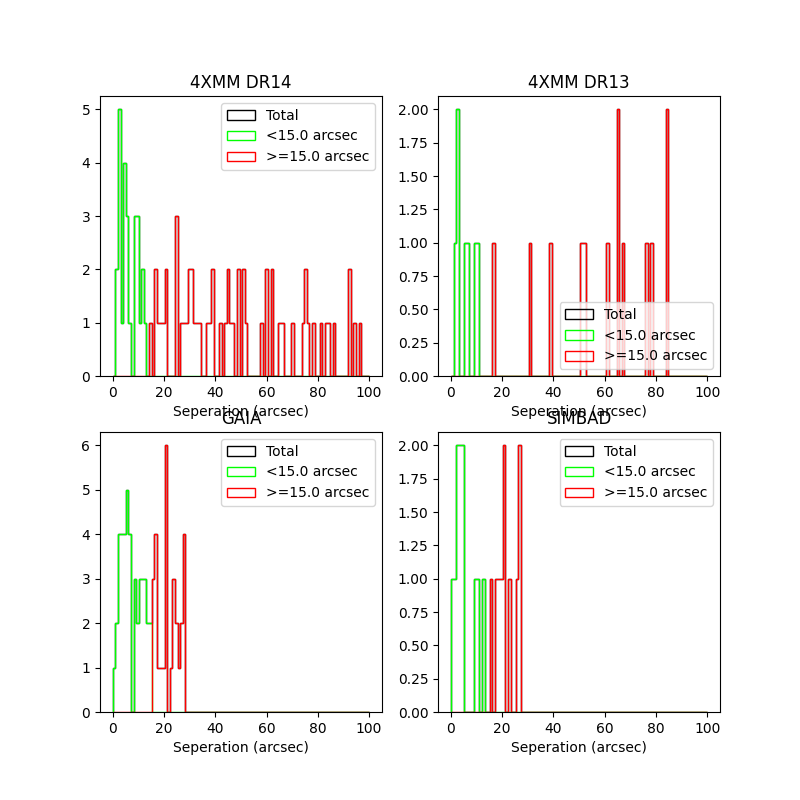
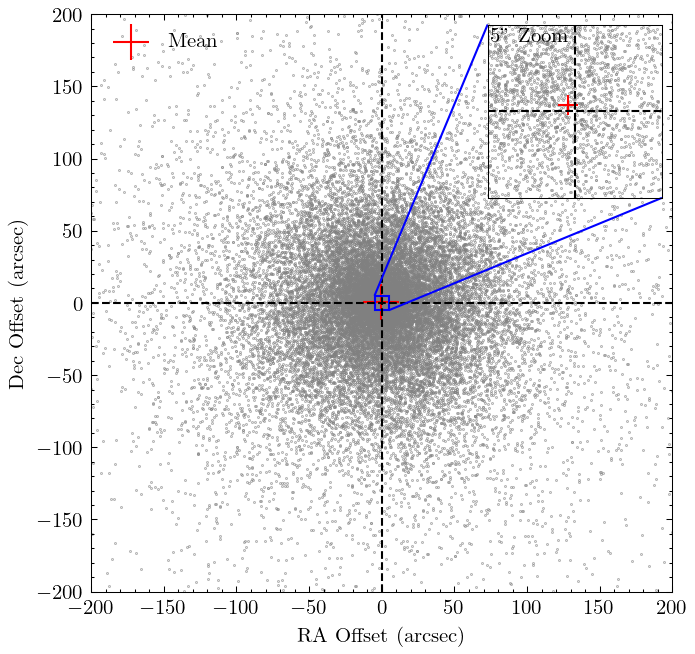
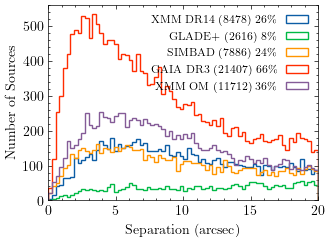
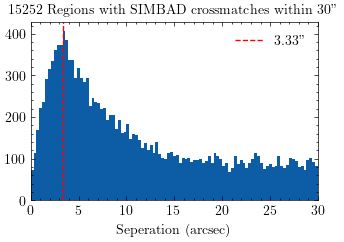
crossmatch_seperations.png
bayes_successrate_timebinning2.png
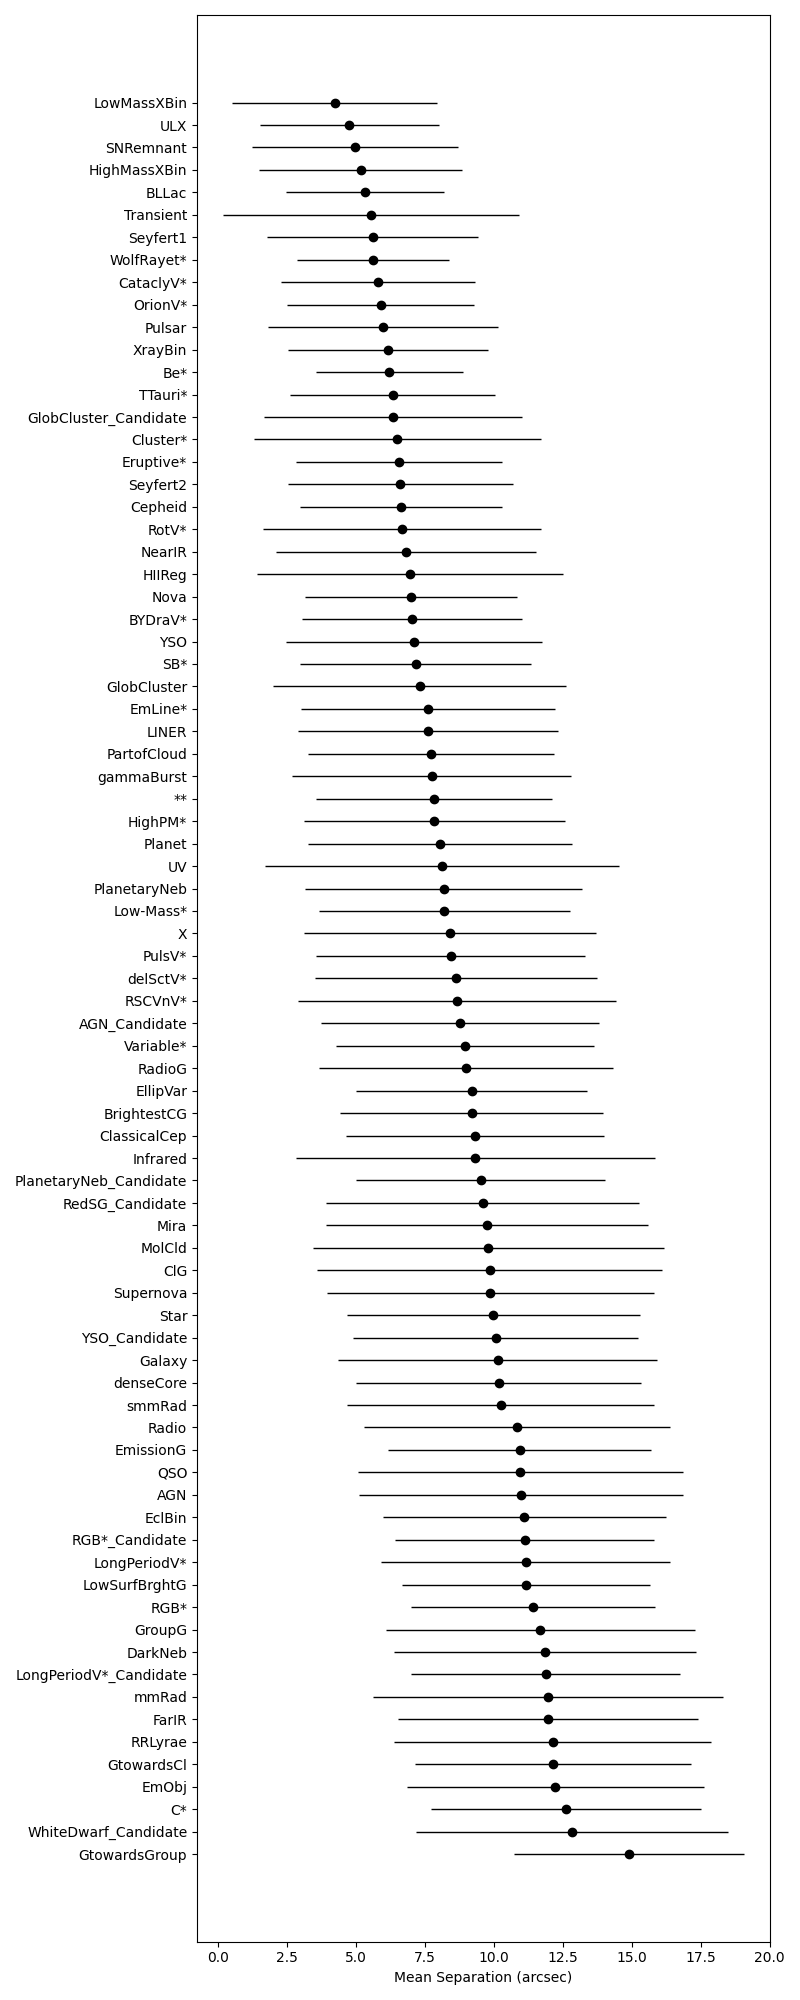
otype_seperations.png
bayesfactorlimits_3.png
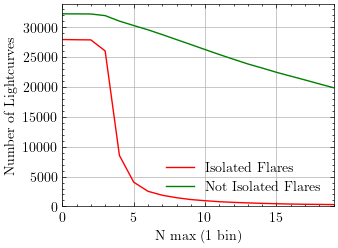
number_of_isolated_flares.png
transients_hist_rotated.png
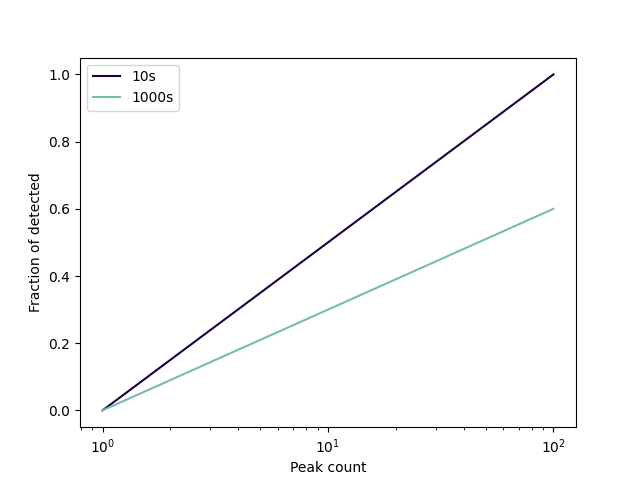
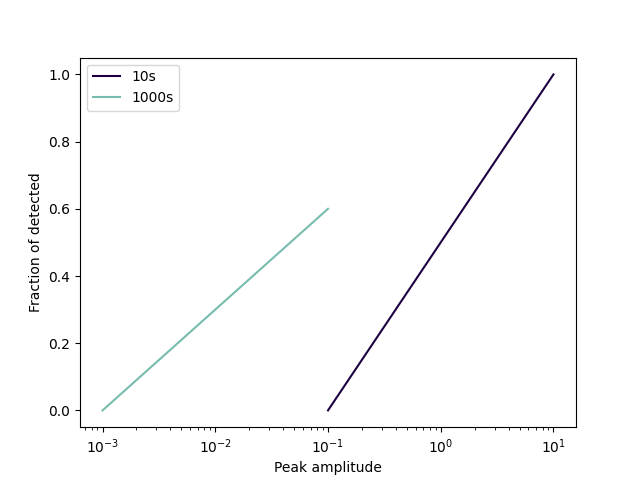
bayes_eclipse_successrate_depth.png
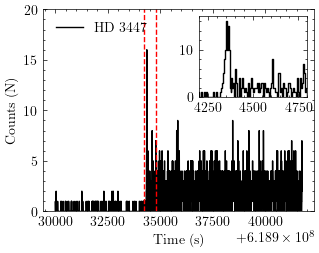
HD_3447_large.png
check_eclipse_estimate_success2.png
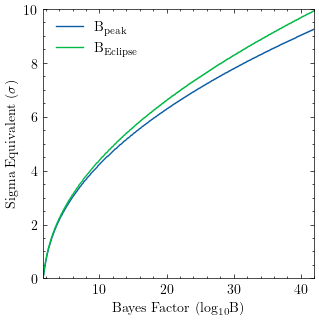
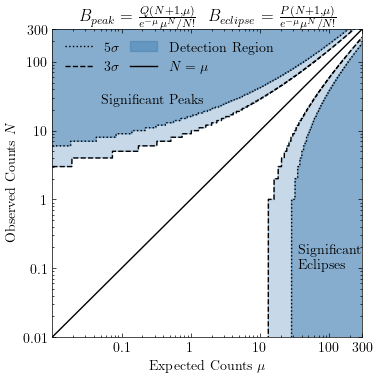
B_eclipse.png
athena_exod.png
cluster_radius_n_sources.png
B_values_3d.png
spatial_dist_0.2_2.0.png
check_estimate_success1.png
Significance_plot.png
tornado_spec_nofit.png
tornado_burst_lc.png
source_against_n_counts_filter.png
check_eclipse_estimate_success1.png
Flux_comparison.png
spatial_dist_2.0_12.0.png
bayes_rate_estimate.png
bayesfactorlimits_5_zoomed.png
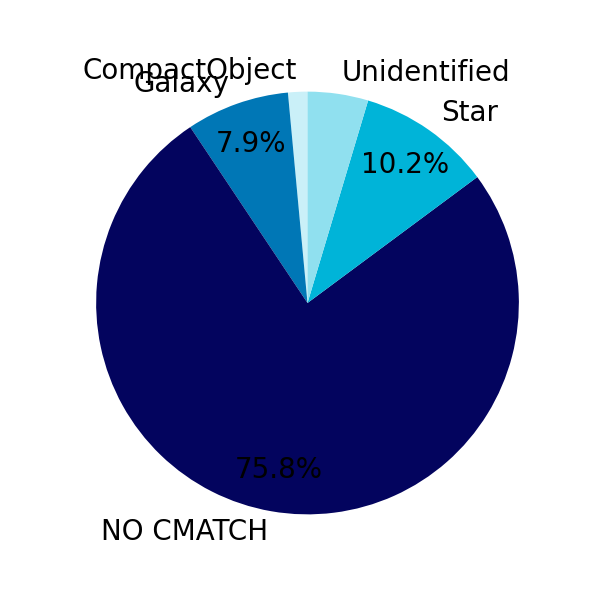
crossmatch_pie_chart.png
gaia_hr_diagram.png
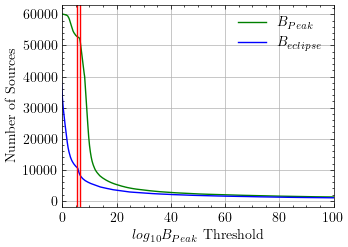
B_peak_threshold_vs_N_reg.png
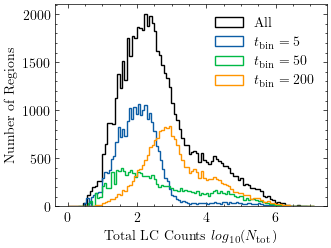
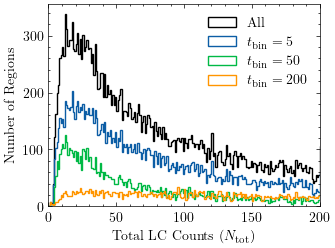
total_lc_counts_hist.png
bayesfactorlimits_5.png
dr14_offsets.png
HD_3447.png
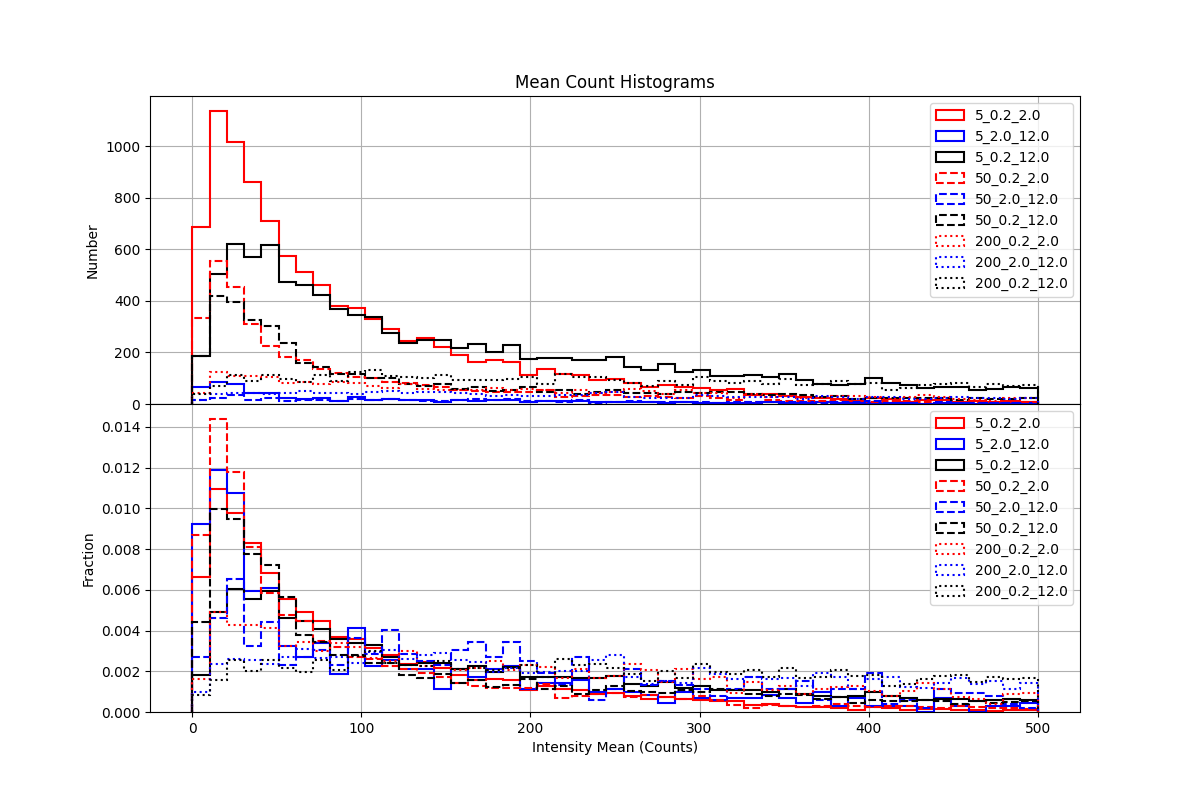
mean_count_histogram.png
transients.png
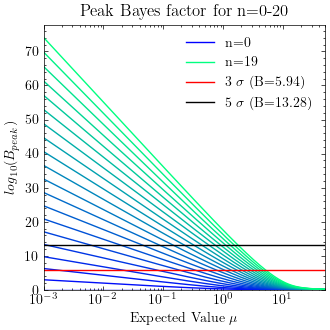
plot_some_n_bayes.png
crossmatch_sep.png
B_factor_vs_sigma.png
HD_3447_zoom.png
B_eclipse_histogram.png
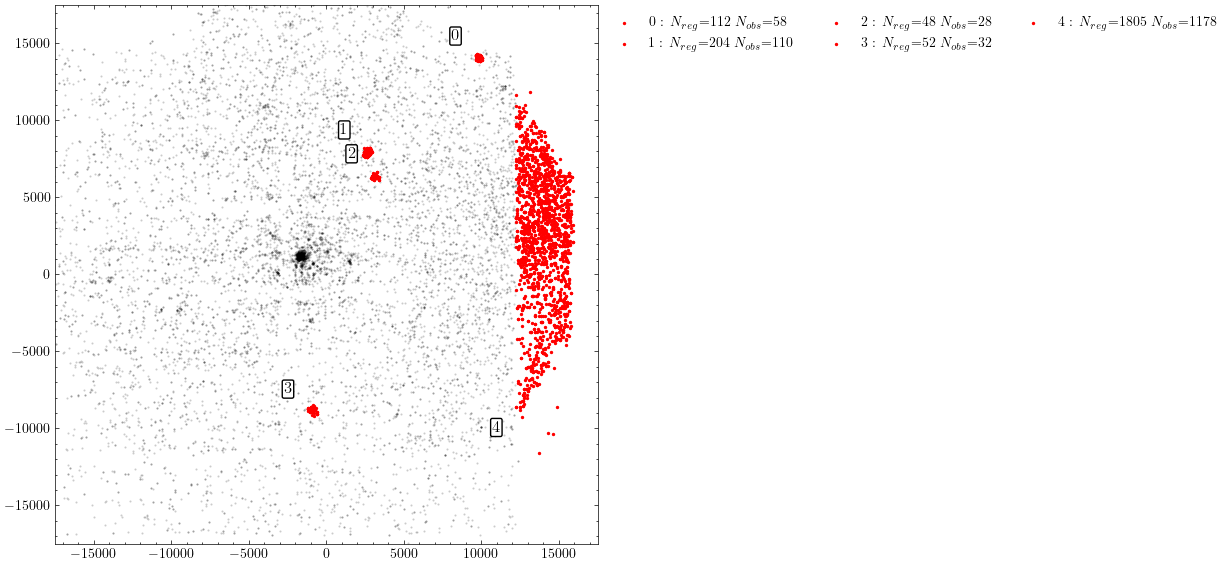
unique_reg.png
check_estimate_success2.png
B_values_distribution_all_regions.png
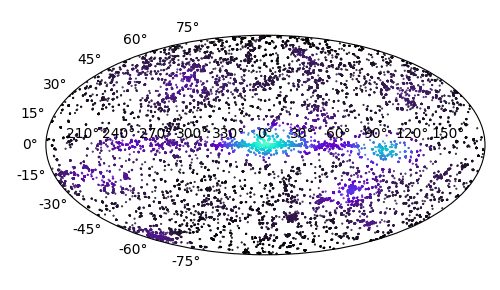
unique_regions_aitoff.png
benchmarking_side_by_side.png
HD_200560_lc_10s.png
accepted_n_values.png
crossmatch_confusion_matrix.png
unique_sources.png
mean_observed_count_rate.png
hydra_A_spec_lc.png
data_cube_frame_with_inset_and_box.png
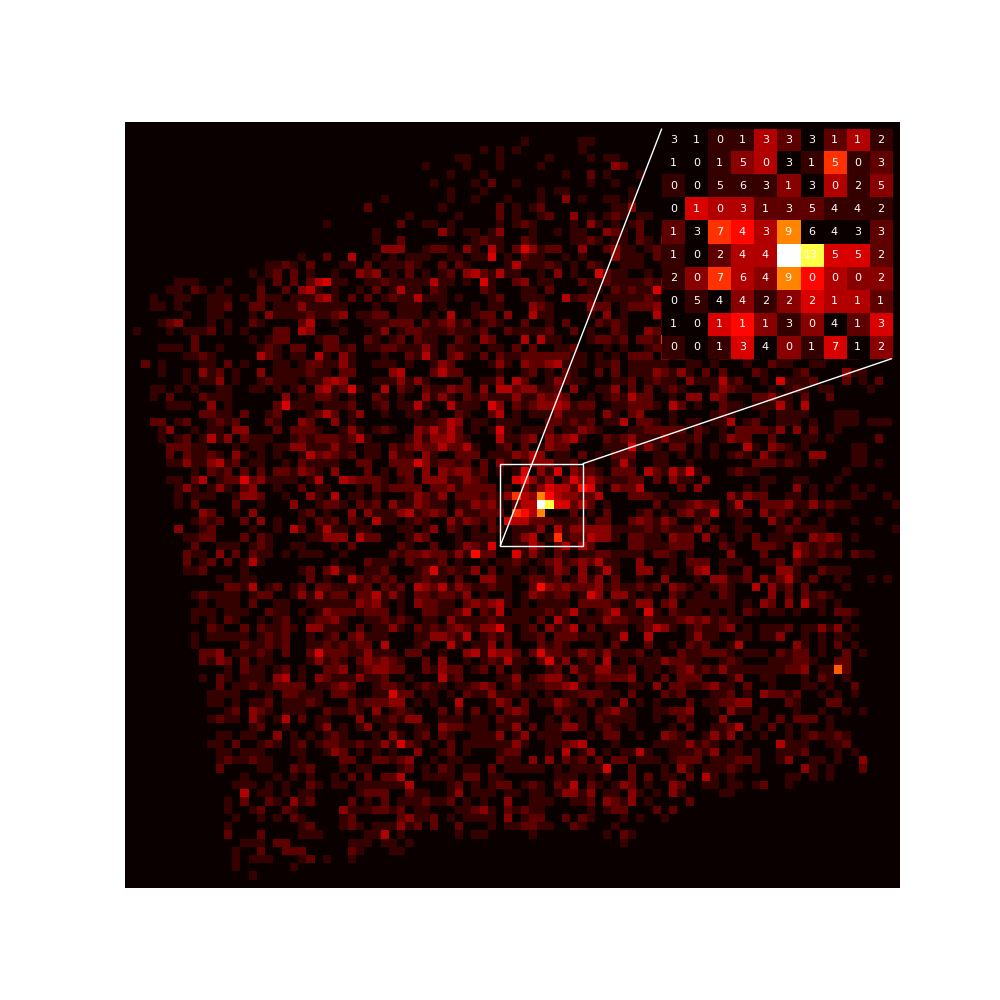
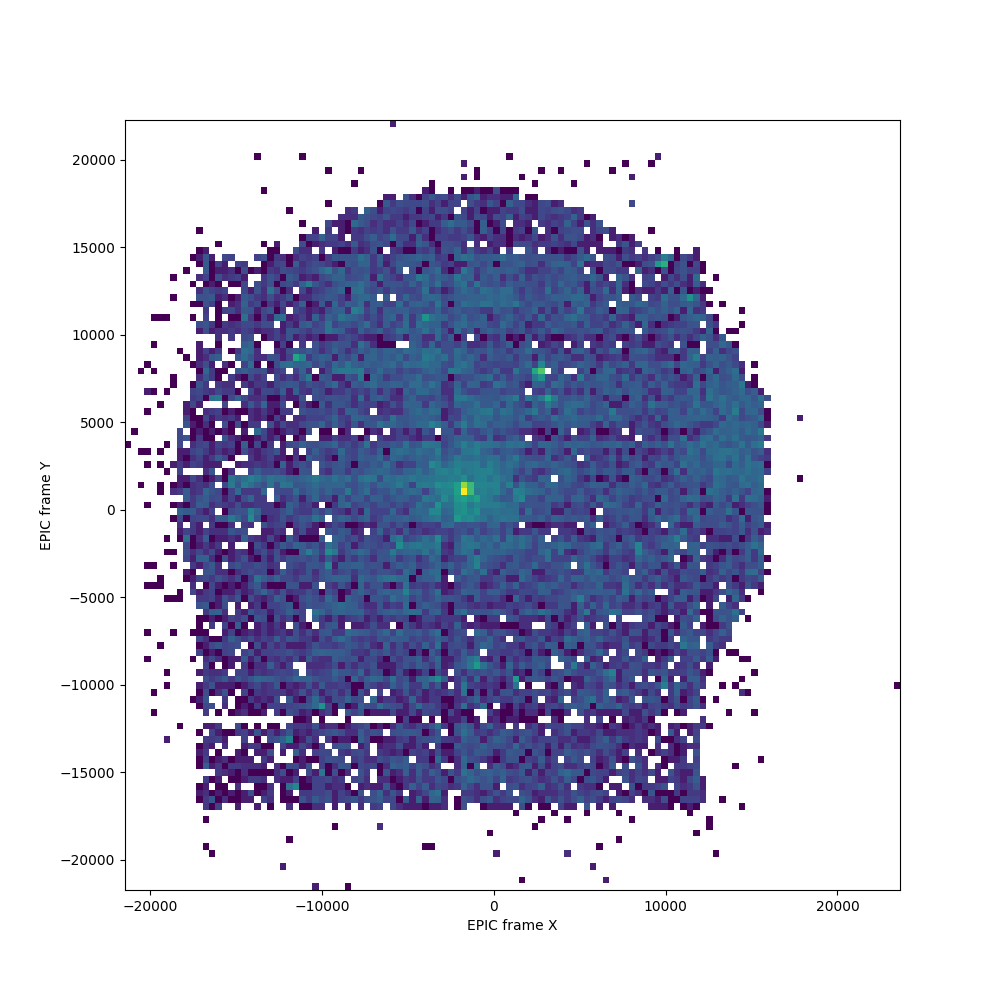
data_cube_frame.png
total_lc_counts_hist_small_n.png
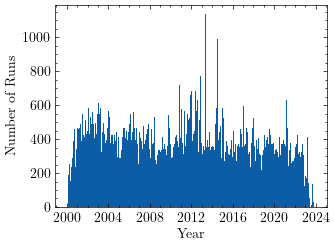
exod_runs_vs_date.png
bayes_successrate_timebinning1.png
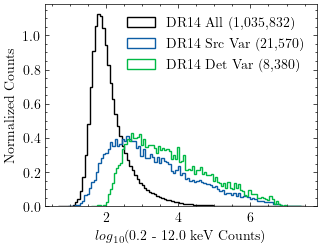
dr14_cts_hist.png
SIMBAD_seperations.png
bayesfactorlimits_3_5.png
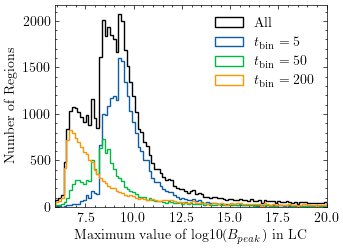
B_peak.png
B_peak_histogram.png
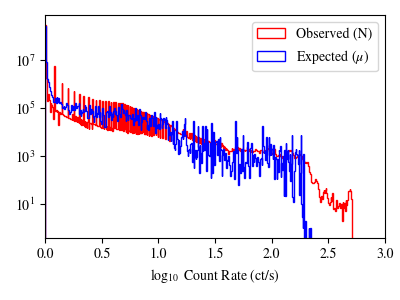
N_mu_dist_all_lc.png
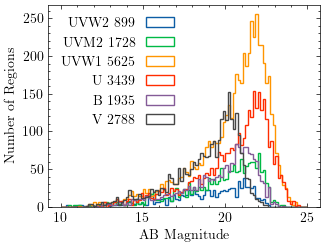
OM_magnitudes.png
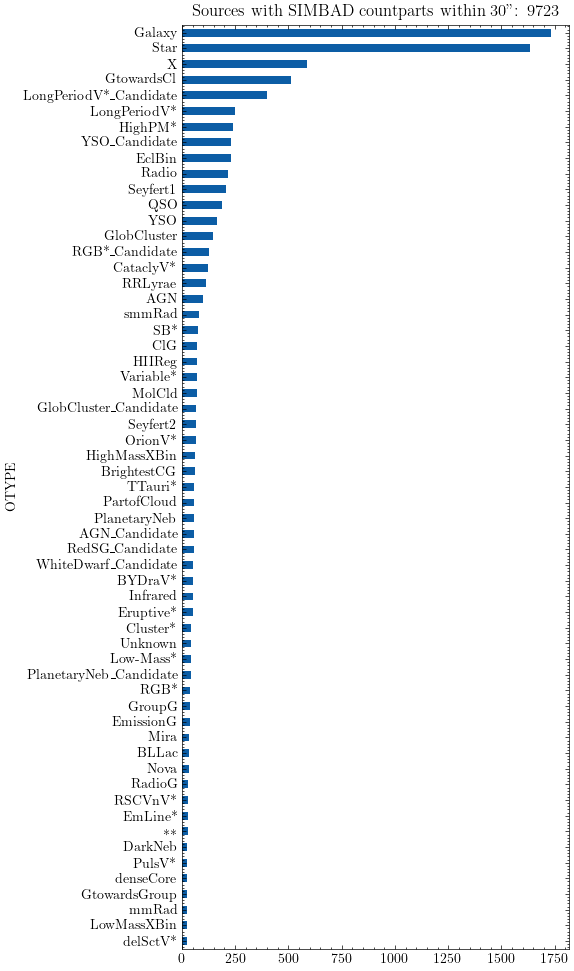
SIMBAD_counterparts_classification.png
simbad_exod_subclass_piechart.png
hot_regions_50_s.png
hot_regions_5_s.png